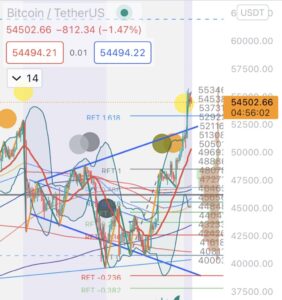
Bitcoin hasn’t been doing well lately, but today it has recovered to $43.5K level, up 5%.
The repulsive line was the Fibonacci retracement. Let’s analyze it in detail while looking at the chart.
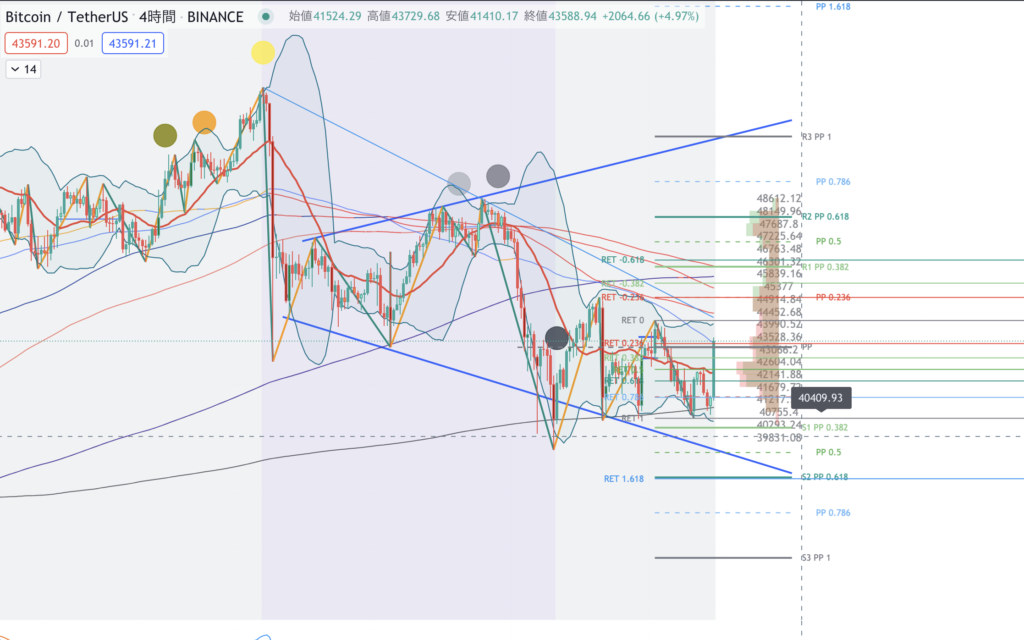
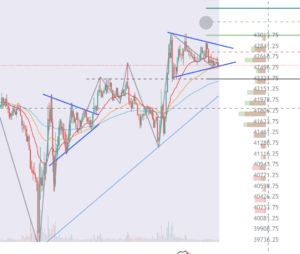
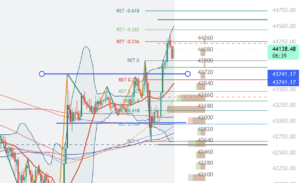
Bitcoin 4H chart
Today’s Bitcoin charts is in the form of an extended triangle. It seems that the price is moving along this shape.
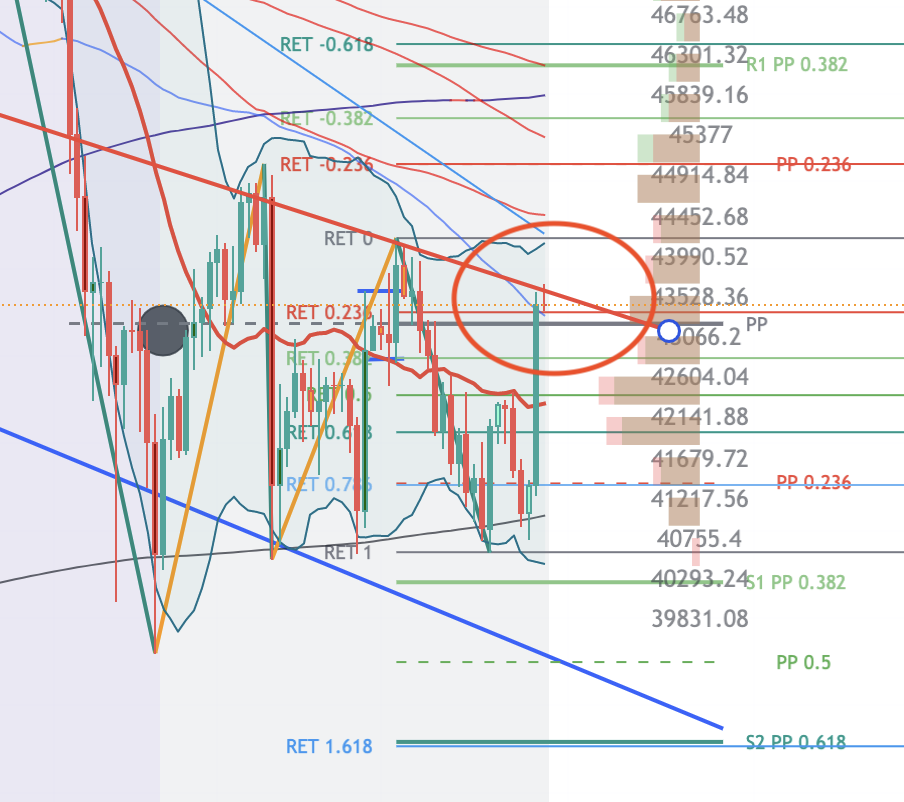
Repulsion with Fibonacci retracement
The line that rebounded in Bitcoin today is the 100% line of Fibonacci retracement.
Easy to understand.
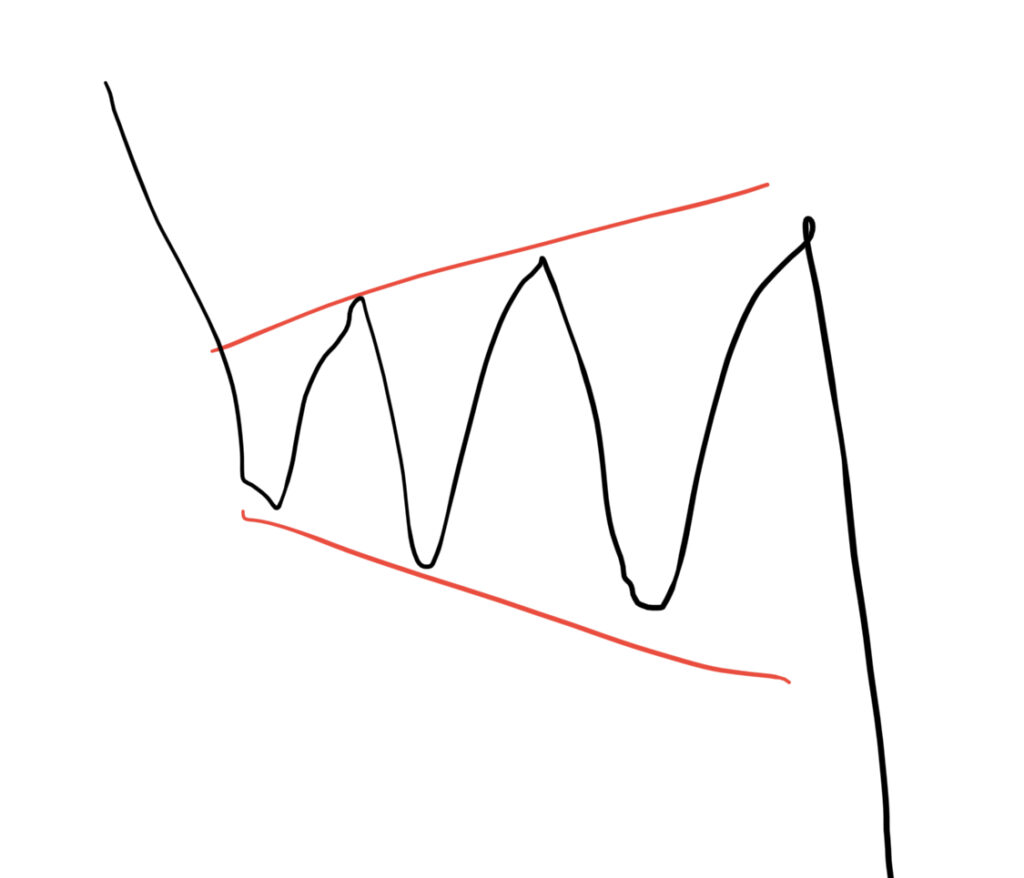
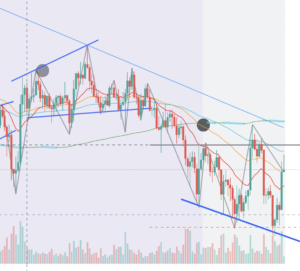
What is the shape of the extended triangle?
This is what the extended triangle chart looks like.
Bitcoin often moves along the shape of the iron plate pattern on the chart.
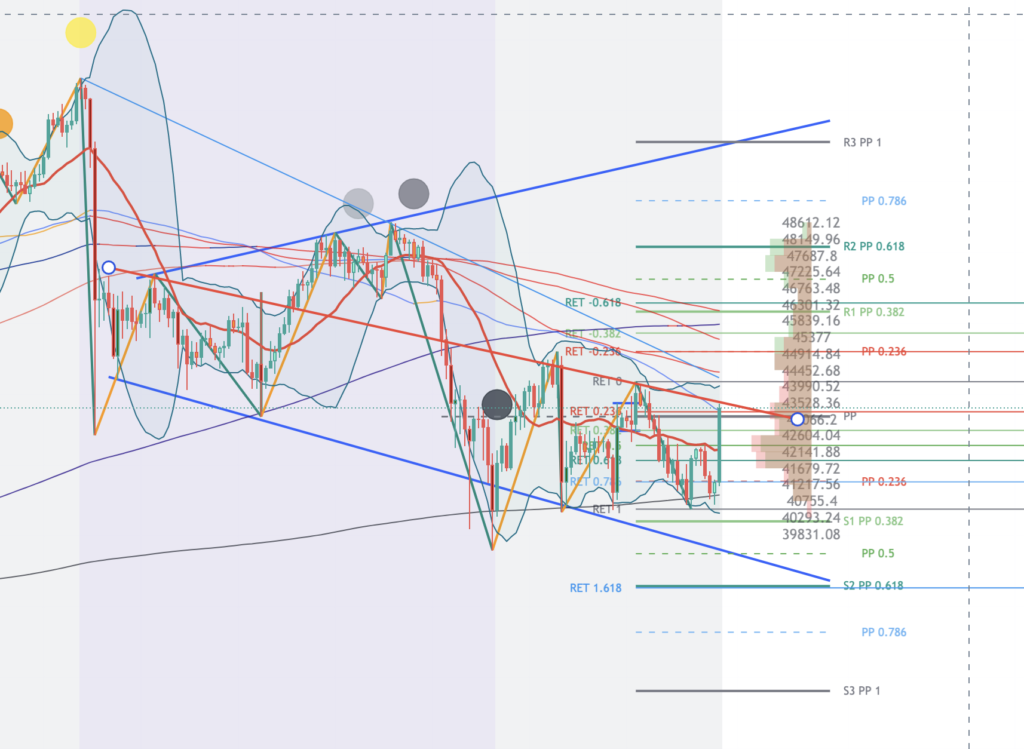
The shape of the chart may be a rectangle
I’m thinking about the extended triangle, but I still can’t rule out the possibility of rectangles.
In the case of Rectangle, the red line is the repulsion line.
From the above, it is a chart that is only a few hours old, but the repulsion is alive. Therefore, I once made a profit. If it breaks like this, I think it’s OK.


Leave a comment