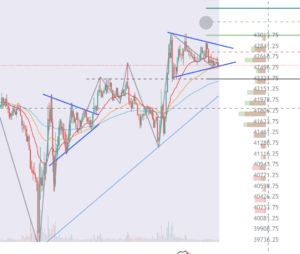
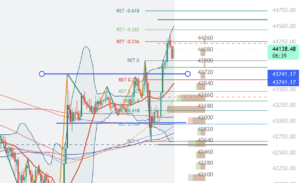
Bitcoin has exceeded $43,500. The Japanese yen has returned to the 5 million yen level for the first time in a while. If you look at the 1h chart, you can see the factors well.
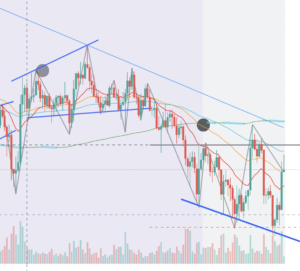
BTC 1H chart
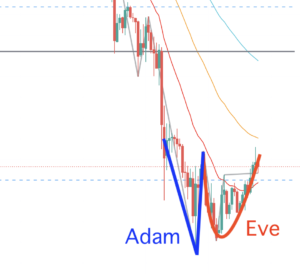
The shape of the chart is important. It’s patterned, and it’s pretty much what it does.
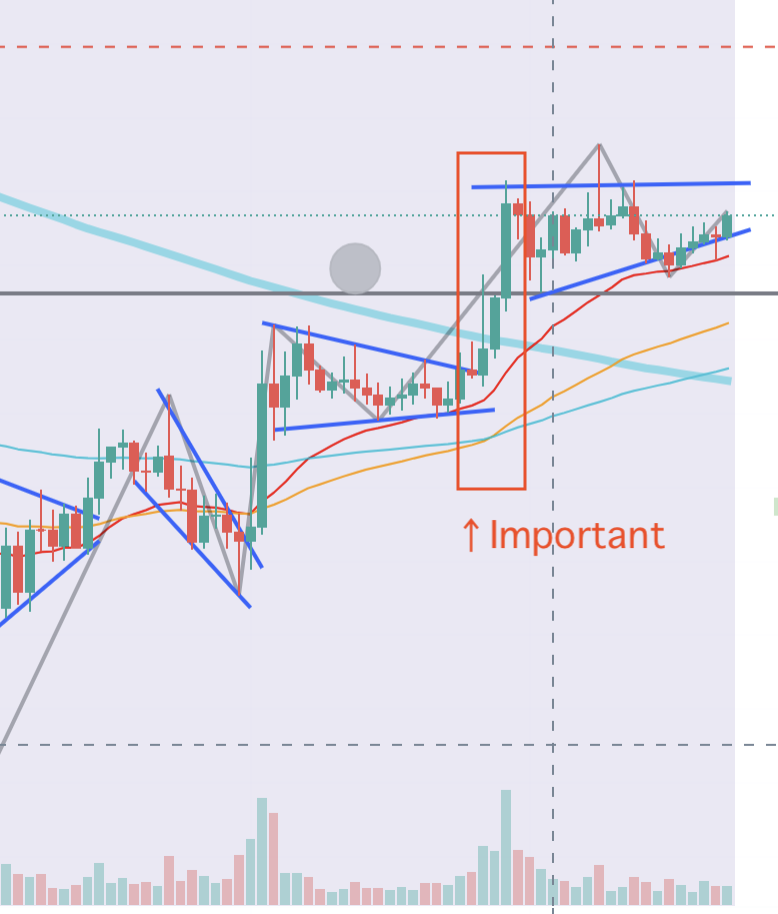
Yesterday’s Bitcoin chart had the same shape. As I wrote in yesterday’s article, I broke through.
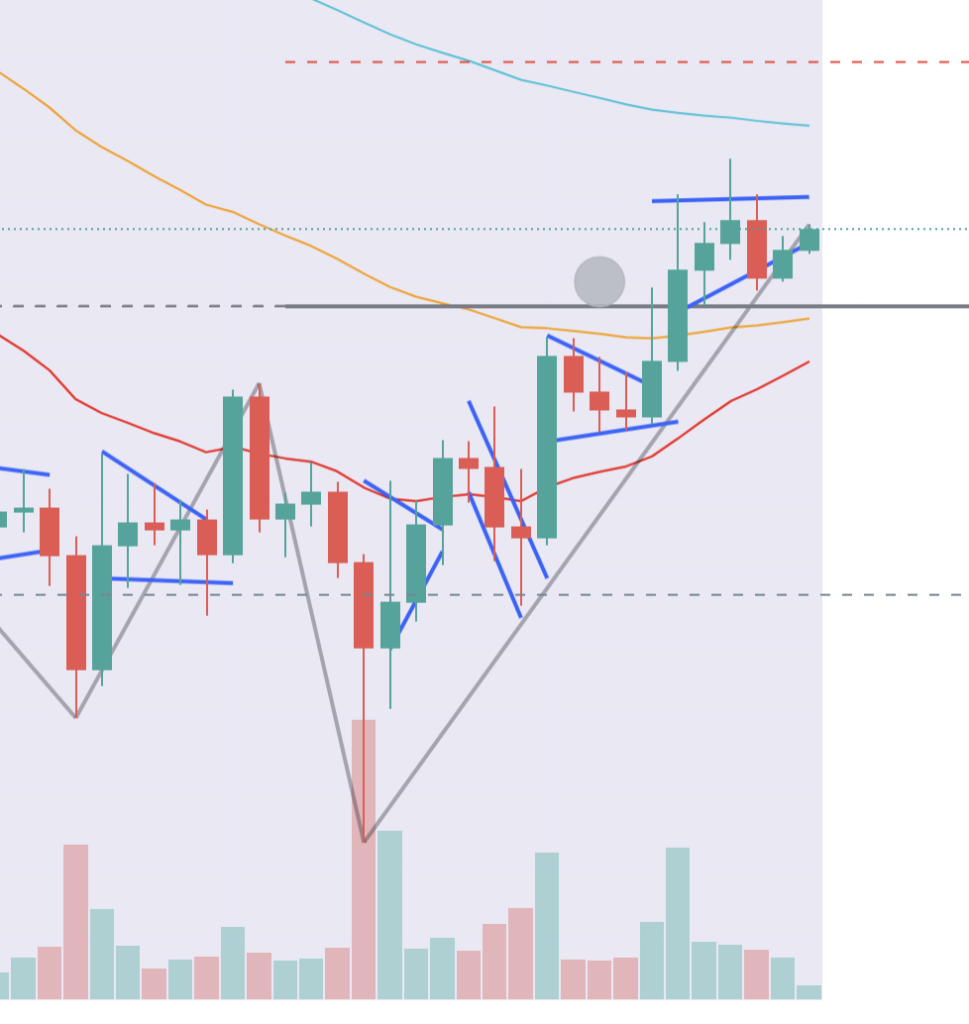
Over 200SMA (simple moving average)
It greatly exceeded my expectations and broke through to 200 MA.
200 MA is an important resistance line that is said to be a trend change.
The point here is that 20, 40, and 60 moving averages are lined up in order, forming an uptrend.
When the chart passes through 200 MAs, the resistance line will change to the support line, so I think it will not be a while before it plummets from here.
Points to be worried about
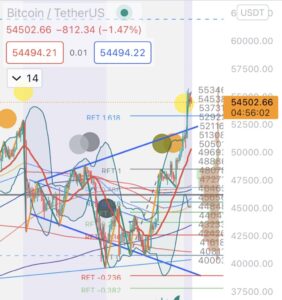
The 4H chart is still in the midst of a downtrend. Rather, it is the timing of the return sale.
Looking at the following sites where you can see the long and short ratios, there are still many short ratios on the long time axis.
I think it’s UP in the short term
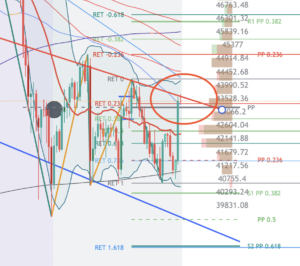
In the long term, the chart shows that there may be a decline, but in the short term, it may rise a little more. From here, you should also check the 4-hour and weekly bars. I think I’ll hit the ceiling there and make some adjustments.

Leave a comment