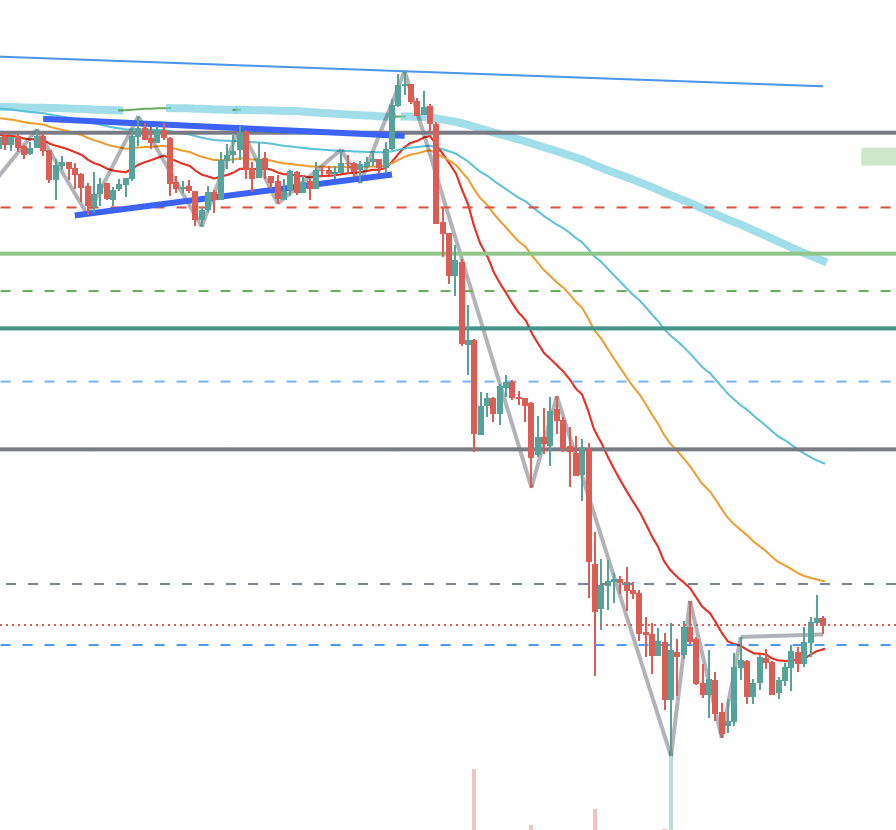
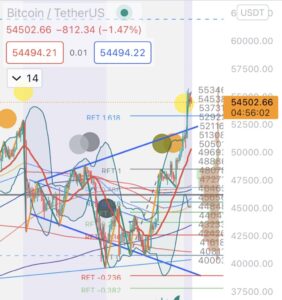
Bitcoin couldn’t see the bottom, but today, on 2022/1/22, there was a sign to display the bottom price. BTC formed Adam and Eve in 1 hour. I explained in detail in the article.
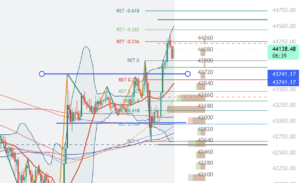
Bitcoin 1-hour chart
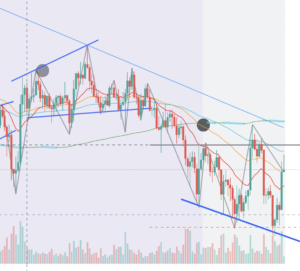
The shape of the chart below is called Adam and Eve, and is said to be a sign that the bottom price has been reached.
What is the sign of Adam and Eve?
The signs of Adam and Eve look like this:
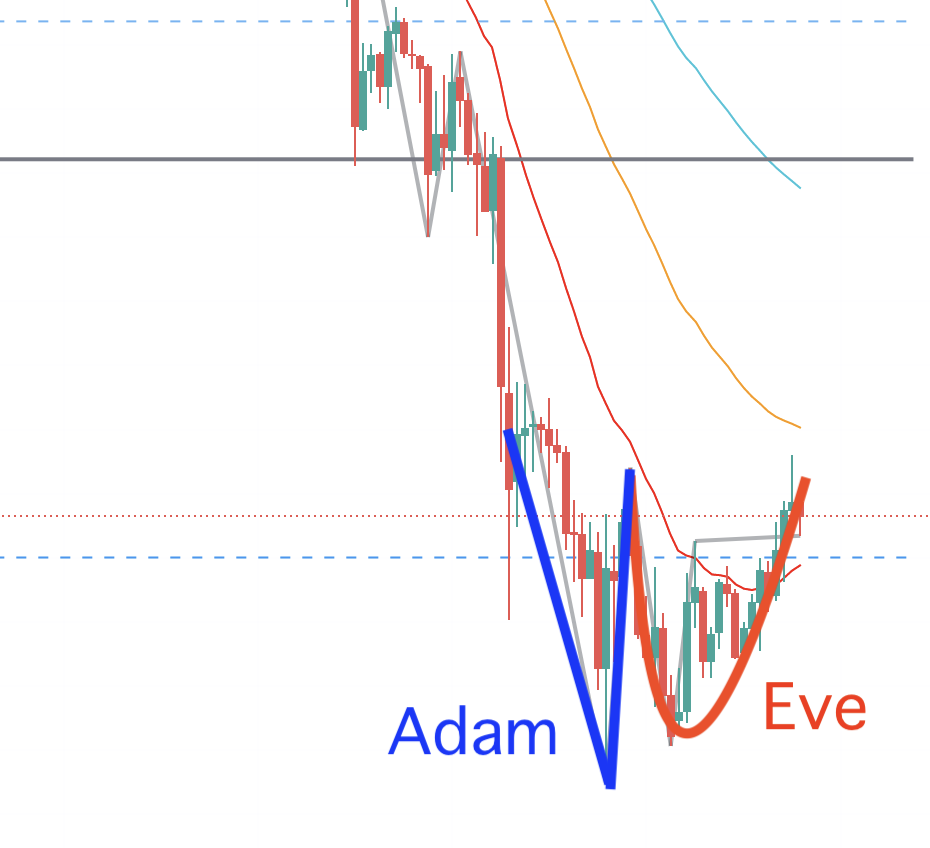
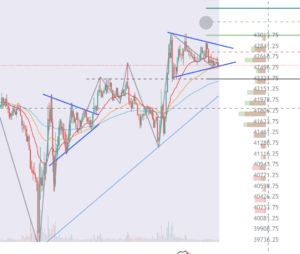
There are many patterns in which the price range of the latest plunge directly leads to the price range of the rise. Therefore, when the price of Bitcoin rises, it will probably rise from 50 MA to around 60 MA.
Price movements during past Adam and Eve formation
Looking at past patterns, the trend has changed and is rising after the formation of Adam and Eve.
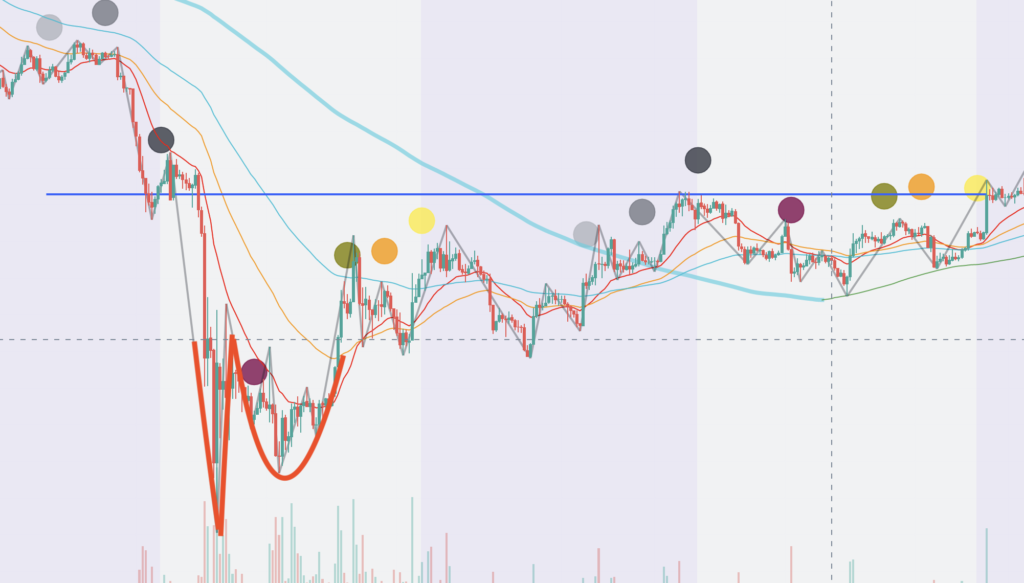
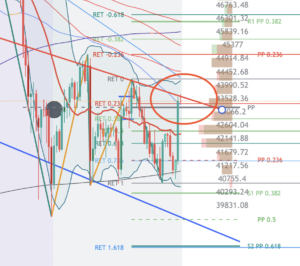
Verification in combination with the moon phase trading
Looking at past patterns in combination with the moon phase trade using the phases of the moon, after the trend change during the Adam and Eve formation period, it did not rise immediately, but was about the same as when the two full moons were reached. It seems that it often returns to the price.
What is the Moon phase trading?
The following article summarizes moon phase trading.


Leave a comment