Bitcoin these days was in the middle of a downtrend. However, it seems that it will finally turn to the bottom. After all, it’s important to keep an eye on the movement of whales.
Bitcoin chart analysis
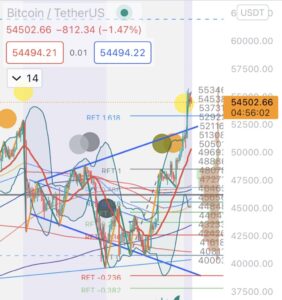
I looked at the 15-minute and 1-hour bars and analyzed them. If you look at it on an hourly basis, you can clearly see the movement of the big mouth.
15-min chart
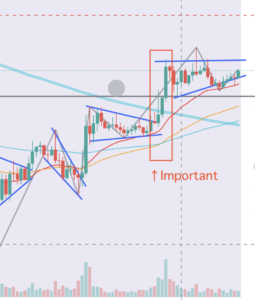
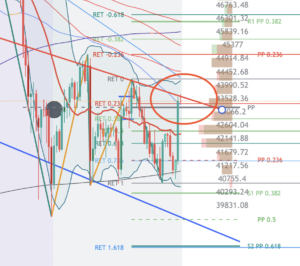
Bitcoin has just entered an uptrend on the 15-minute chart. I was wondering if the downtrend would return again, but thanks to the big deal, the uptrend is continuing. I think it was quite dangerous.
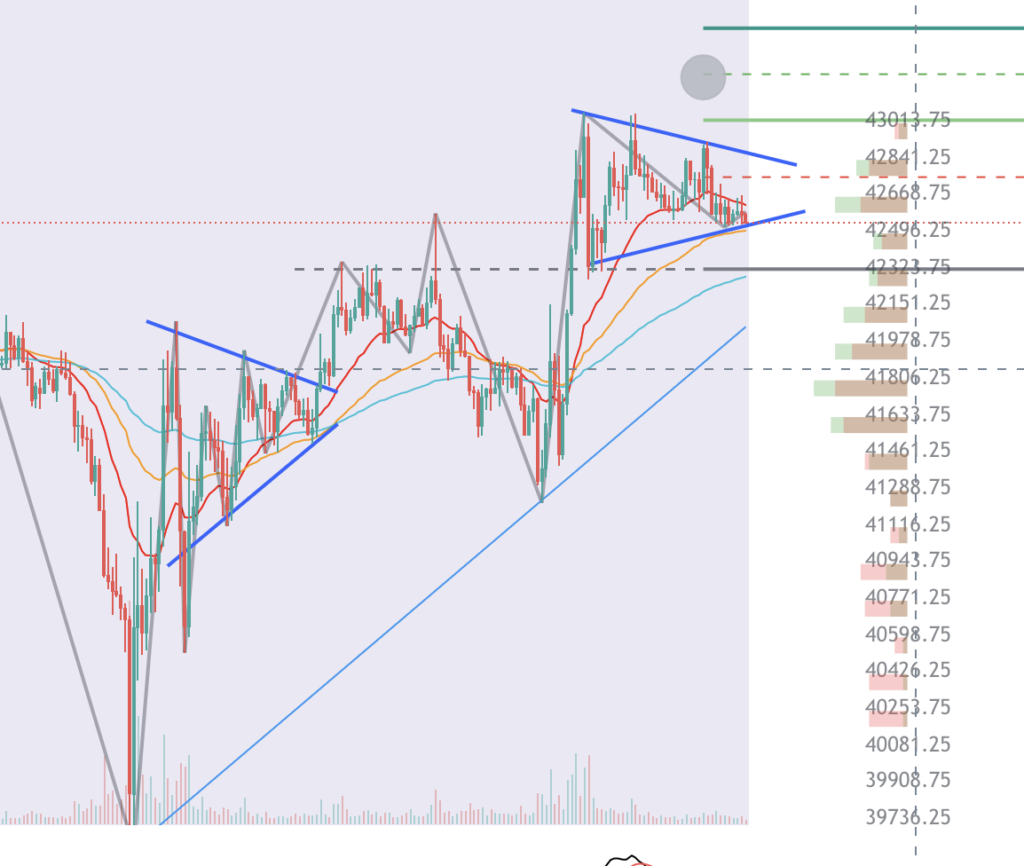
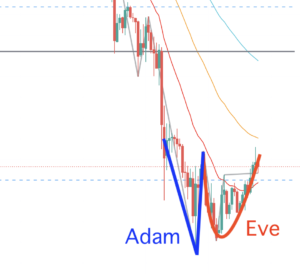
This formation pattern (chart shape) probably goes up.
1-hour chart
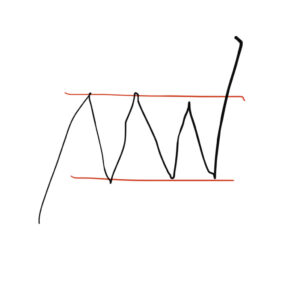
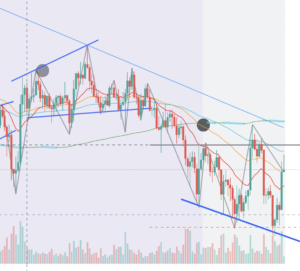
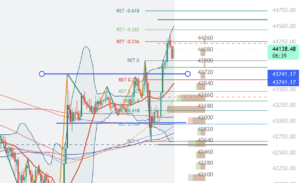
It is easy to understand that this shape was forcibly formed in 1-hour.
At the point of return of the downtrend, it forcibly breaks up and turns up.
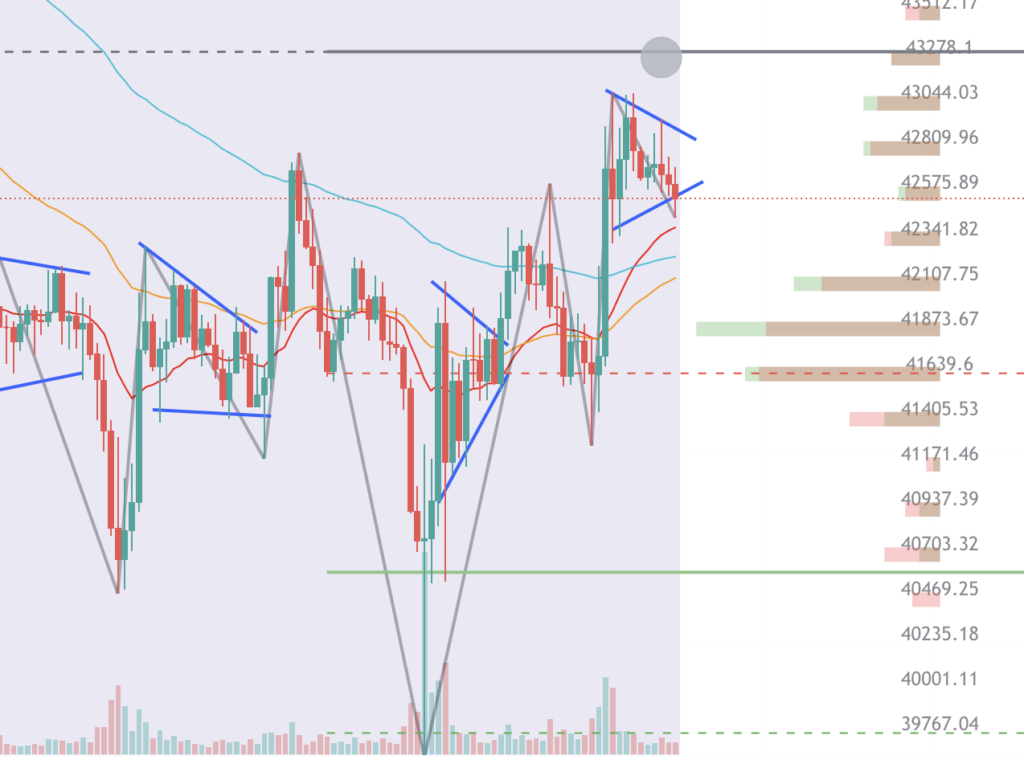
During the time of the sharp rise, the shorts were burned and the ratio of longs went up.

6 days until the new moon
Buy in the new moon and sell in the full moon (London time). There is an anomaly called.
Recently, I am trading in this anomaly main. There are 6 days left until the new moon. My own tool turned on.
Since the new moon often hits the latest bottom price, it is often lowered once.
Past patterns are summarized in this article.


By the way, the time of the new moon and the full moon is UTC0.

Leave a comment